
Page 10 - MariCare
P. 10
Elma® Detection – An invaluable assessment tool
Elma® Detection system provides important information on the activity and daily rhythms of individuals living at home
– without the need for on-site visits. At what times and where they move around at home? Do they leave the bedroom?
When do they use the toilet? Do they go to the refrigerator for meals? How much and at what times of the day do they sleep?
Elma® offers the possibility to monitor long-term developments in activity or movement, providing essential information for
assessment units, home care, doctors, and physiotherapy teams to support decision-making. The information provided by
Elma® also reduces the worry of family members.
Long-term diagrams provide valuable information
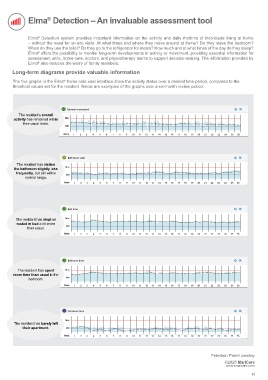
The five graphs in the Elma® home care user interface show the activity status over a desired time period, compared to the
threshold values set for the resident. Below are examples of the graphs over a six-month review period:
General movement
The resident’s ove20rall Max
activity has remaine11d68 within Min
their usual limit1s4.
12
10
8
Week 1 2 3 4 5 6 7 8 9 10 11 12 13 14 15 16 17 18 19 20 21 22 23 24 25 26
The resident has visited Bathroom visits
the bathroom slightly less
Max
frequently, but still within Min
normal range. Week 1 2 3 4 5 6 7 8 9 10 11 12 13 14 15 16 17 18 19 20 21 22 23 24 25 26
The resident has slept or Bed time
rested in bed a bit more
Max
than usual. Min
Week 1 2 3 4 5 6 7 8 9 10 11 12 13 14 15 16 17 18 19 20 21 22 23 24 25 26
Bedroom time
The resident has spent Max
more time than usual in the Min
bedroom.
Week 1 2 3 4 5 6 7 8 9 10 11 12 13 14 15 16 17 18 19 20 21 22 23 24 25 26
Outdoors time
The resident has barely left Max
their apartment. Min
Week 1 2 3 4 5 6 7 8 9 10 11 12 13 14 15 16 17 18 19 20 21 22 23 24 25 26
Patented / Patent pending
©2025 MariCare
www.maricare.com
10